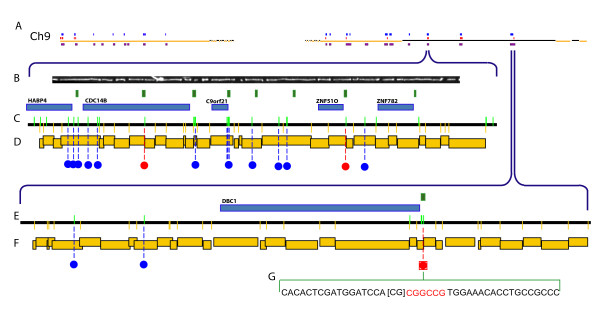
Figure 5.
Profiling methylation sites in the human genome. Optical mapping tabulations of hyper- and hypomethylation across human Ch 9. A; Optical mapping findings of hypomethylation (16 – red marks) and hypermethylation (75 – blue marks) are shown aligned to an in silico SwaI restriction map (gold and black horizontal lines) of entire human Ch 9 (Build 35, hg17; 140 Mb). Optical maps constructed from a dual SwaI, EagI digestion and then overlapped forming contigs (purple boxes) are shown aligned to the in silico SwaI (methylation insensitive) map. B; Image of a single human DNA molecule (~400 kb) contained in the contig (469 kb) depicted in D; C, E; Detailed EagI (green vertical lines on track), SwaI (yellow vertical lines below line) in silico map of respective regions of human genome with blue (hypermethylation) and red (hypomethylation) dots showing methylation sites identified by optical mapping. Blue boxes represent genes, and green boxes show CpG islands. D, F; EagI, SwaI optical map contig with the restriction fragments size scaled and represented by staggered gold boxes. Contig D and F respectively span chromosome 9: Build 35, hg 17; start 96,297,748 bp, end 96,766,284 bp (D); start 118,802,475 bp, end 119,384,765 bp (F). G; An expanded view of a methylation call adjacent with Illumina findings showing nucleotide composition; red nucleotides show a hypomethylated EagI site with surrounding sequence (black). The CpG dinucleotide reported as hypomethylated by Illumina is bracketed [CG].

