
Figure 5.
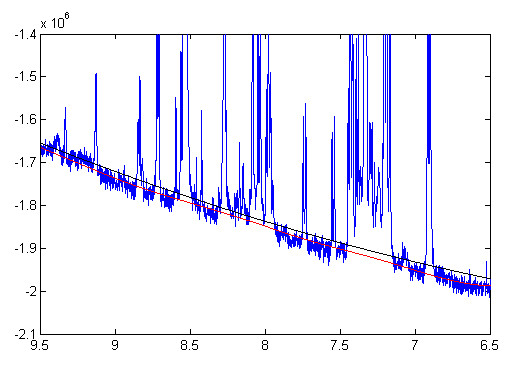
Comparison of baseline distortion detection by penalized smoothing methods and XWIN-NMR 3.5. This is an expanded region of the spectrum in Figure 4 before baseline correction. Baseline curves are detected by penalized parametric method (red) and XWIN 3.5 automatic baseline correction function (black).