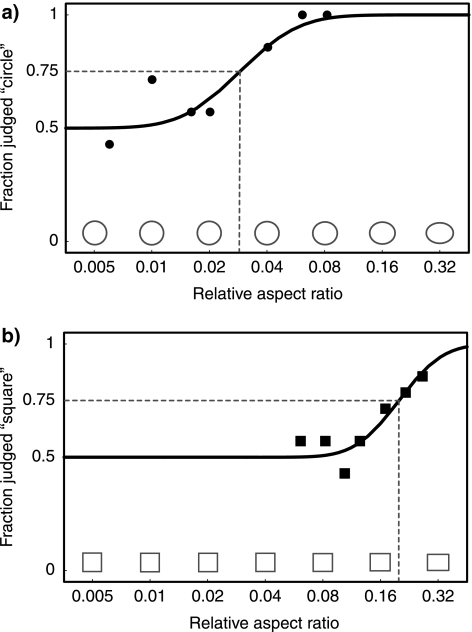
Fig. 3.
Examples of psychometric curves for an ellipse condition (a) and for a rectangle condition (b). The response is plotted against the relative aspect ratio, which is defined as the aspect ratio minus 1. Note that a logarithmic scale is used. The ellipses (rectangles) that are drawn above the horizontal axis illustrate the shape of the ellipse (rectangle) for the values that are indicated on the horizontal axis. A psychometric function was fitted to the data. The detection threshold is defined as the relative aspect ratio value for which the psychometric function equals 0.75

