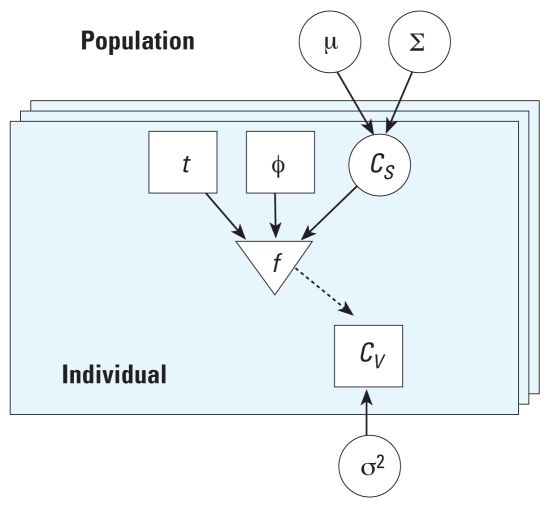
Figure 1.
Graphic model (adapted from Bernillon and Bois 2000). Circles represent unknown quantities to be updated via Bayes’ theorem: population mean (μ) and variance (∑), concentrations (CS), and error (σ2). Squares represent the known quantities of time (t), PBPK model and exposure parameters (φ), and measured blood concentrations (CV). The triangle represents the deterministic model (f ). The solid arrows represent conditional dependence, and the dashed arrow represents a deterministic link. Individuals are represented by the layered boxes, and are considered to be a subset of the population.

