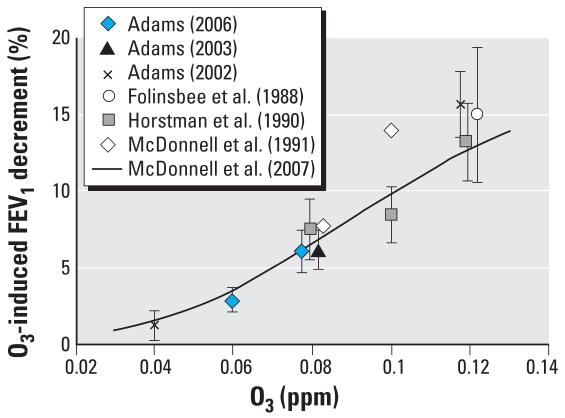
Figure 2.
Cross-study comparison of mean O3-induced FEV1 decrements due to 6.6 hr of constant, S-W exposure to varied O3 concentrations. All exposures were conducted in a chamber, except for a face-mask exposure to 0.04 ppm O3 in the Adams (2002) study. All studies used a 6.6-hr exposure protocol in which volunteers alternated between 50 min of exercise (VE ≈ 20 L/min/m2 BSA) and 10 min of rest with an additional 35 min of rest after the third hour. For this exposure protocol, the McDonnell et al. (2007) curve illustrates the predicted FEV1 decrement at 6.6 hr as a function of O3 concentration for a 23-year-old. Error bars (where available) are the SE of responses. The data at 0.08 and 0.12 ppm have been offset for illustrative purposes.

