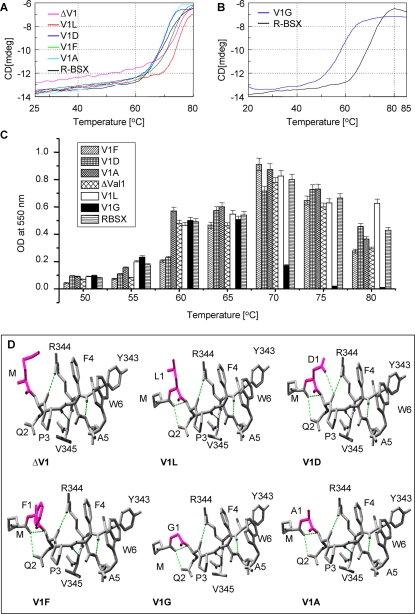
Figure 3. Thermal denaturation and structural features of the R-BSX mutants.
(A) CD spectra of thermal denaturation of ΔV1, V1L, V1D, V1F, V1A and R-BSX monitored at 222 nm with a temperature slope of 1°C/min. (B) CD spectra of thermal denaturation of V1G and R-BSX, showing the ∼12°C decrease in Tm for V1G. (C) Xylanase activity profile of R-BSX mutants at various temperatures. Maximum activity for V1G was observed at 60°C, differing from other mutants which showed maximum activity at 70°C similar to that of R-BSX. (D) SwissPdb-generated structural models showing the N-terminal region of all R-BSX variants. The amino acid substituted for Val1 is shown in pink. The additional hydrogen bonds resulting from a deletion/substitution are shown in green dotted lines.

