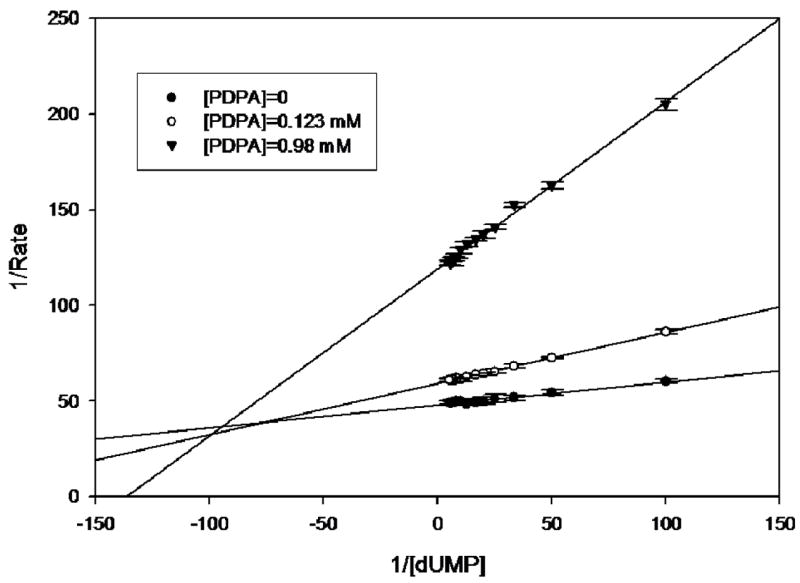
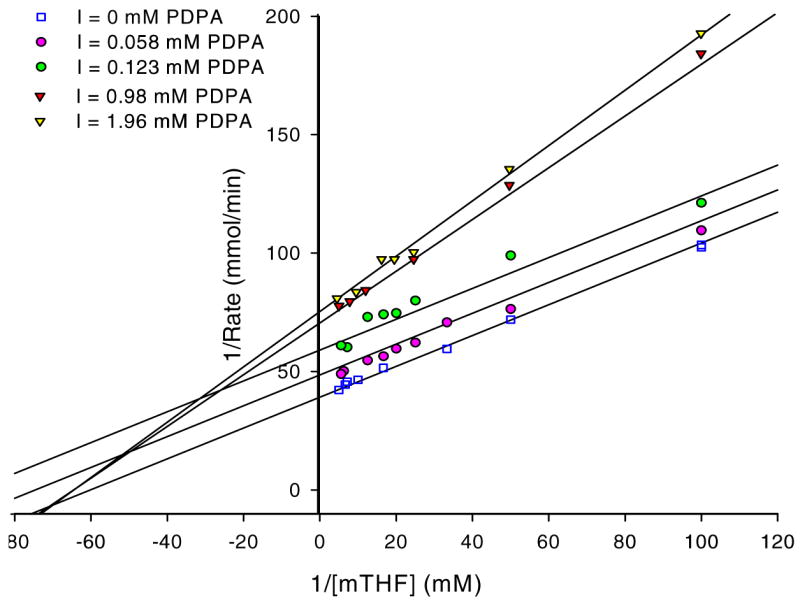
Figure 3.


hTS inhibition by PDPA. The results are presented as a Lineweaver-Burke plot. (SigmaPlot v9.0.1) A) Versus dUMP. Error bars represent standard deviations based on five measurements for each point. Fig 3B) Versus the cosubstrate, CH2H4folate. The ratios of standard deviations to the rates are 0.013, 0.006, 0.032, 0.032, 0.018 for increasing concentrations of PDPA as shown in the inset. Numerical data are included as supplementary material.
