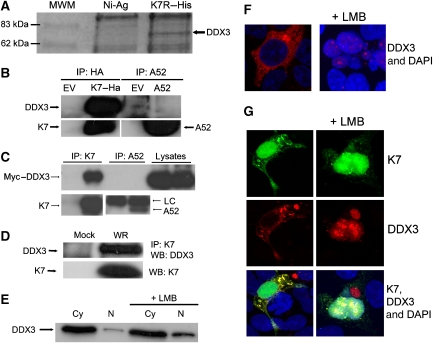
Figure 4.
K7 but not A52 interacts with DDX3. (A) HEK293 cell lysates were added to purified His–K7 coupled to Ni-Agarose and incubated for 2 h at 4°C. The immune complexes were precipitated, subjected to SDS–PAGE and stained with Coomassie blue. A band of approximately 70 kDa (marked with an arrow) that appeared specifically in the K7 pull-down lane was excised, prepared for MALDI-TOF analysis and shown to be DDX3. (B) HEK293T cells were transfected with HA–K7R, A52R or empty vector (EV) and 48 h later, lysates were subjected to immunoprecipitation analysis to detect endogenous DDX3. (C) HEK293 cells were transfected with Myc–DDX3 expression plasmid. After 24 h cells were mock infected or infected with WR at 10 p.f.u. per cell, and 8 h later lysates were subjected to immunoprecipitation analysis with K7- or A52-specific antiserum LC: antibody light chain. (D) HEK293 cells were mock infected or infected with WR at 10 p.f.u. per cell and 8 h later, cell lysates were subjected to immunoprecipitation with K7-specific antiserum, followed by immunoblotting with the indicated antibodies. (E) HEK293 cells were either left untreated or incubated with 25 mM leptomycin B (LMB) for 4 h. Cytoplasmic (Cy) and nuclear (N) extracts were analysed for DDX3 by immunoblotting. (F) HEK293 cells were grown on 22-mm coverslips in six-well plates and transfected with the HA–DDX3 expression plasmid for 48 h and then 25 mM LMB was added. Cells were fixed 4 h later, permeabilised and stained with anti-HA-AlexaFluor594 and the DAPI nuclear stain. The slides were examined by phase-contrast and confocal microscopy. A section of approximately 1 μm through the centre of a cell is shown. (G) HEK293 cells were grown as in (F) and transfected with HA–DDX3 and K7–EYFP expression plasmids for 48 h. LMB (25 mM) was then added and the cells were fixed 4 h later, permeabilised and stained with anti-HA-AlexaFluor594 and DAPI. The slides were examined by phase contrast and confocal microscopy. A section of approximately 1 μm through the centre of cells is shown. Results shown for (A–G) are representative of at least two experiments.

