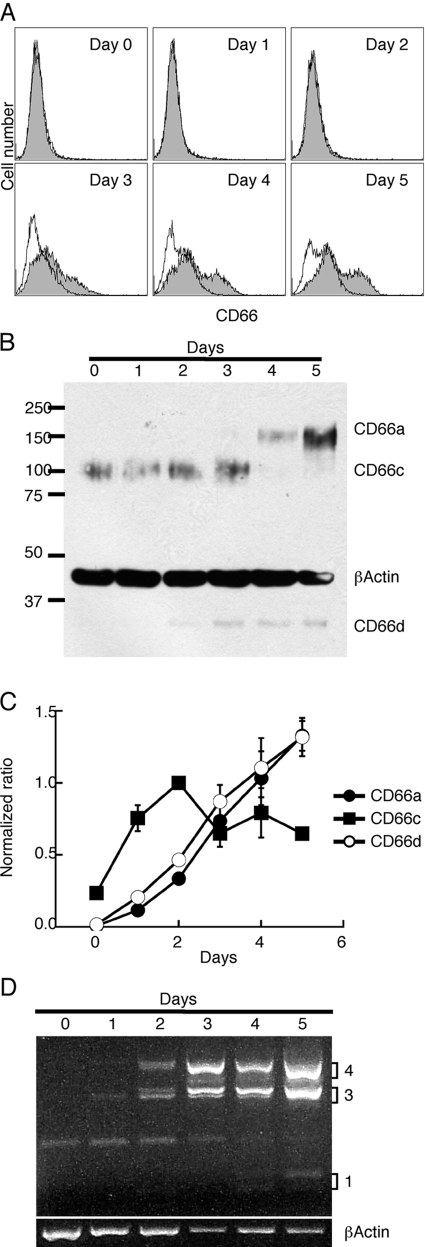
Fig. 2.
CD66 expression in ATRA-treated HL-60 cells. Time course of expression of (A) CD66a, -c, and -d by FACS analysis; (B) CD66a, -c, and -d by Western blot analysis; (C) CD66a, -c, and -d by qRT-PCR; and (D) CD66a isoforms by RT-PCR on ATRA-treated HL-60 cells. RT-PCR was normalized to β-actin expression. All experiments were repeated at least twice with similar results.

