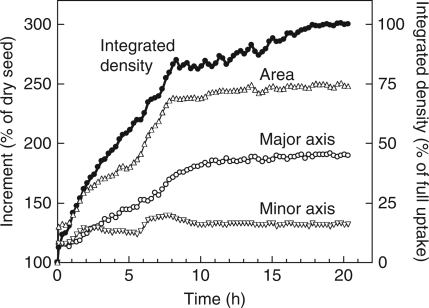
Fig. 5.
Time course of water uptake, increase of size, and increments of the major and minor axes of soybean. Measurements were carried out on the same section as in Fig. 2. Water amount (density) is indicated by the integrated signal intensity, and the increase of size is indicated by the area of the bean. The increments (%) of area, the major axis and the minor axis are given by [(Vt – V0)/V0] × 100, where Vt is the value at time t and V0 is the value at time 0.

