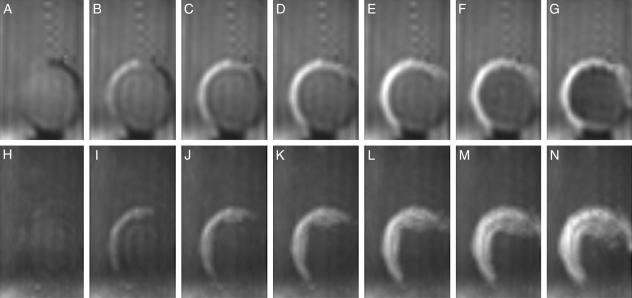
Fig. 7.
Water entry and migration in the testa in the initial stages of imbibition for a soybean (‘Kuromame’). A soybean was fixed by the method indicated in Fig. 1B and images were acquired continuously for 20 h at 15-min intervals after 5 min of imbibition. Changes of soybeans at longitudinal sections parallel to the raphe–antiraphe are shown. Top: images from the γ section (Fig. 1D); bottom: MIP images from δ to ε (Fig. 1D). (A, H) 5 min, (B, I) 20 min, (C, J) 35 min, (D, K) 50 min, (E, L) 1 h 5 min, (F, M) 1 h 20 min, and (G, N) 1 h 35 min.

