
Figure 3.
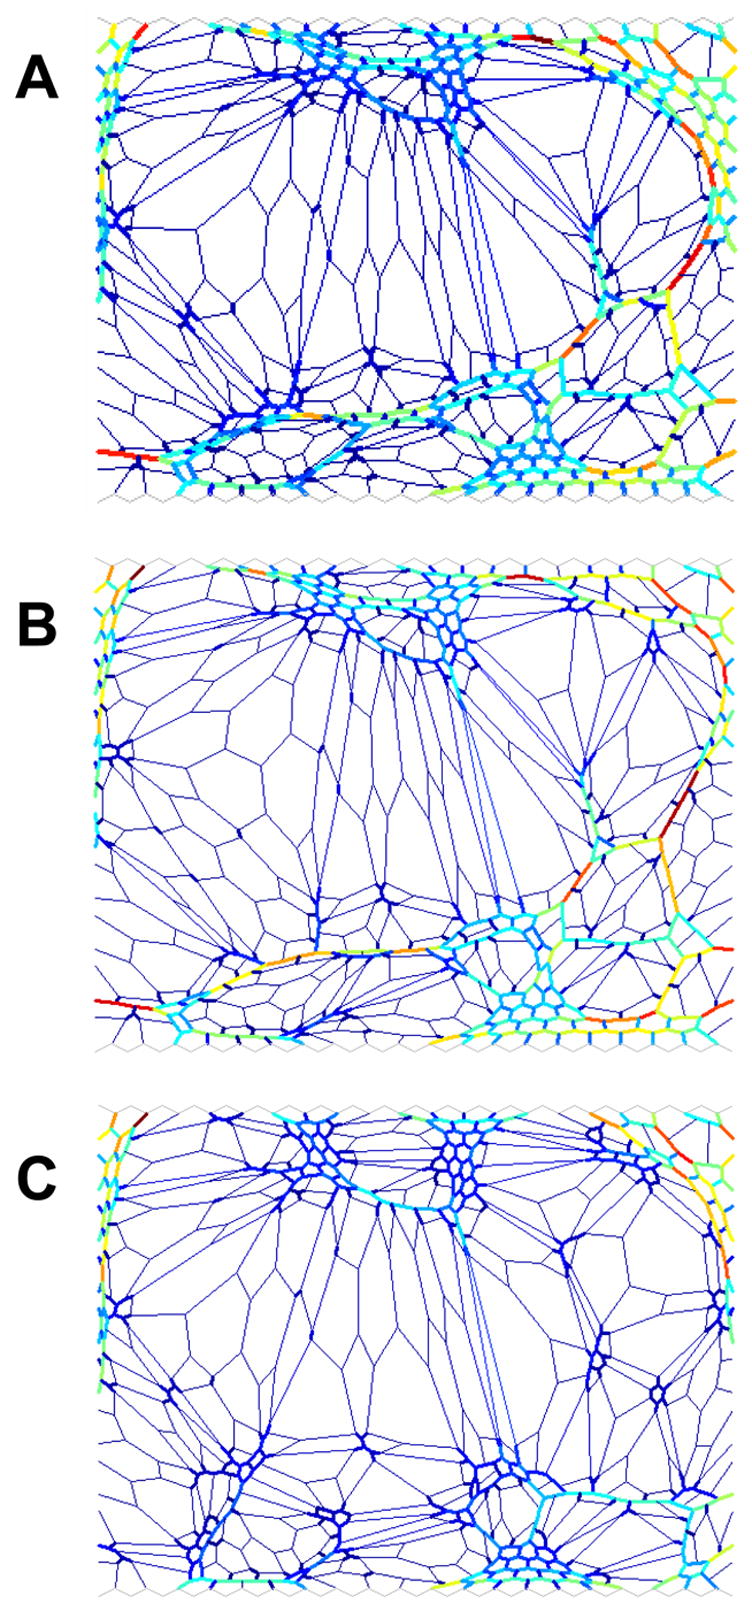
Modeling the repair of the fibrotic lung. The colors are related to the force the elements carry as in Fig. 2. The thick and thin lines denote stiff and soft springs, respectively. A) shows the initial configuration with the concentration of stiff springs c=0.649 and the bulk modulus B=26.6. B) shows the configuration of the network following random repair with c=0.611 and B=22.6. C) shows the configuration of the network following targeted repair with c=0.63 and B=16.