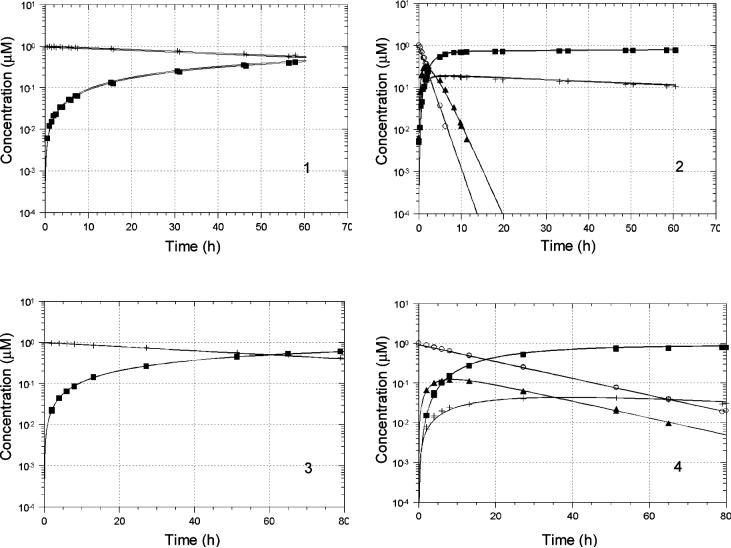
Figure 5.
Reactant and product concentration vs. time profiles for prodrug (left) or hemiorthoester (right) hydrolysis in PBS (pH 3.0) at 37 °C. Starting reactants were: 1, prodrug 1; 2, hemiorthoester I′-1; 3, prodrug 2; and 4, hemiorthoester I′-2. Solid lines represent the fitted parameters shown in Table 2. Symbols: + (1 or 2), ■ (CPT- lactone), ○ (I′-1 or I′-2), ▲ (I″-1 or I″-2).

