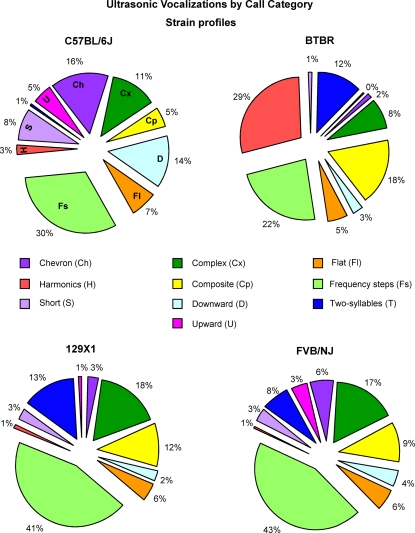
Figure 5. Strain profiles.
Pie graphs show the percentages of the different call categories within strain. Percentages were calculated in each strain as number of calls in each category for each subject/total number of calls analyzed in each subject. Number of total calls analyzed: B6 = 2333; BTBR = 3633; 129X1 = 1806; FVB/NJ = 2575.

