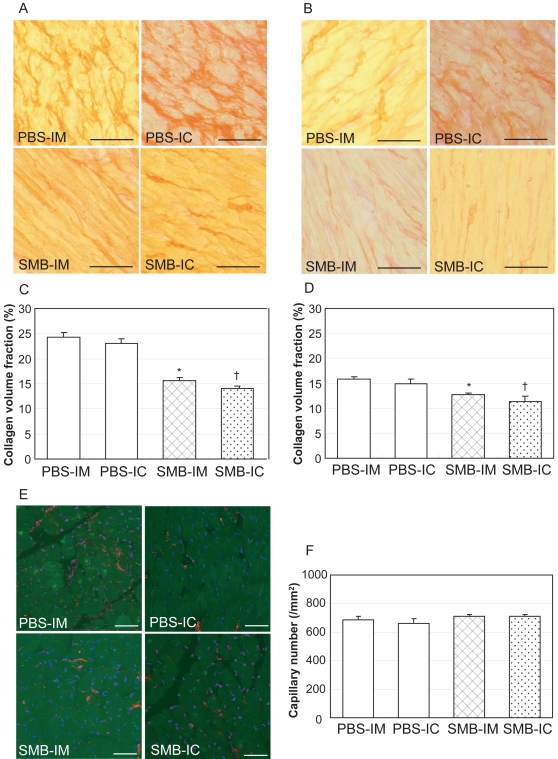
Figure 6. Extracellular collagen and capillary density in the myocardium.
A: Extracellular collagen deposition in the myocardium was assessed by Picrosirus red staining at day 28. Representative pictures in the peri-infarct area show a marked accumulation of extracellular collagen (red colour) in the PBS-IM and PBS-IC groups, compared to the SMB-IM and SMB-IC groups (×400). B: Representative pictures of the infarct-remote area also show reduced collagen accumulation in the SMB-IM and SMB-IC groups, compared to the PBS-IM and PBS-IC groups (×400). C and D: Collagen volume in both the peri-infarct © and infarct-remote (D) areas, analysed by computer-assisted morphometry, was significantly smaller in the SMB-IM and SMB-IC groups, compared to the corresponding PBS groups. E: Capillary number at day 28, assessed by immunoconfocal microscopy (red for vWF, blue for nuclei), appeared to be similar among the groups. F: Capillary density, expressed as the number of capillary vessels per mm2, did not show a significant difference among any groups. Scale bar = 100 µm. *p<0.05 vs. the PBS-IM group; † p<0.05 vs. the PBS-IC group. N = 5 in each group.

