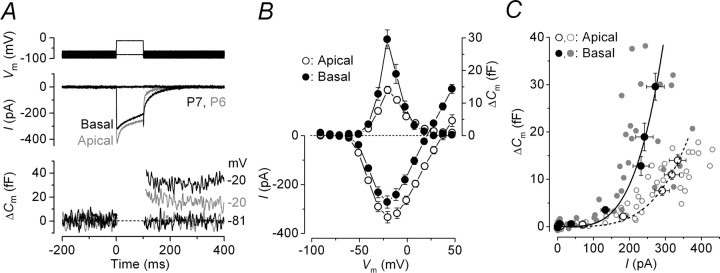
Figure 2.
Ca2+ currents and ΔCm in prehearing gerbil IHCs. A, ICa and ΔCm responses recorded from immature apical (gray traces) and basal (black traces) IHCs. Recordings were obtained in response to 100 ms voltage steps from −81 in 10 mV nominal increments. For clarity, only responses at −81 and −20 mV are shown. B, Average peak I–V (bottom) and ΔCm–V (top) curves from apical (P5–P6; n = 9) and basal (P6–P7; n = 7) IHCs. C, Synaptic transfer functions obtained by plotting average ΔCm against the corresponding ICa between −71 mV and near −11 mV from B for apical and basal IHCs. Single data points (gray circles) are also shown. The fits are according to Equation 1. Error bars indicate SEM.

