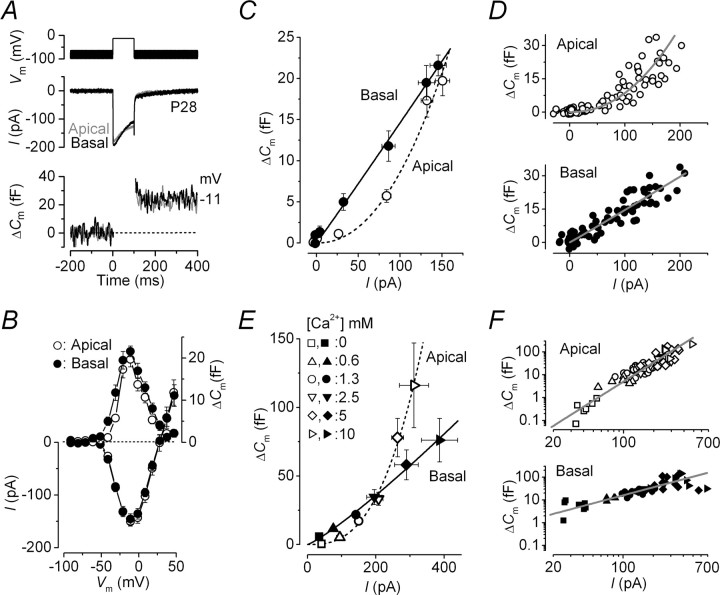
Figure 3.
Ca2+ dependence of exocytosis in adult gerbil IHCs. A, ICa and ΔCm from apical (low-frequency, gray) and basal (high-frequency, black) IHCs. Voltage protocol is as in Figure 1. For clarity, only responses at −81 and −11 mV are shown. B, Average peak I–V and ΔCm–V curves in apical (P22–P34; n = 15) and basal (P20–P30; n = 13) IHCs. C, Synaptic transfer functions obtained by plotting average ΔCm against the corresponding ICa between −71 mV and near −11 mV from B for apical and basal IHCs. The fits are according to Equation 1. D, Single data points used to generate averages in C from apical and basal IHCs. Fits are as in C. E, Synaptic transfer functions from apical and basal IHCs showing average responses at the membrane potential at which the peak ICa from the I–V curve occurred (from approximately −11 to −1 mV) in different Ca2+ concentrations. Fits are using Equation 1. F, Single data points used to generate averages in E from apical and basal IHCs plotted on a double logarithmic scale. Fits are as in E. In both E and F, the number of observations at each Ca2+ concentration (0, 0.6, 1.3, 2.5, 5, 10 mm) were as follows: apical 7, 6, 26, 11, 13, 5 (from 26 IHCs); basal 7, 4, 15, 4, 11, 8 (from 16 IHCs). Error bars indicate SEM.

