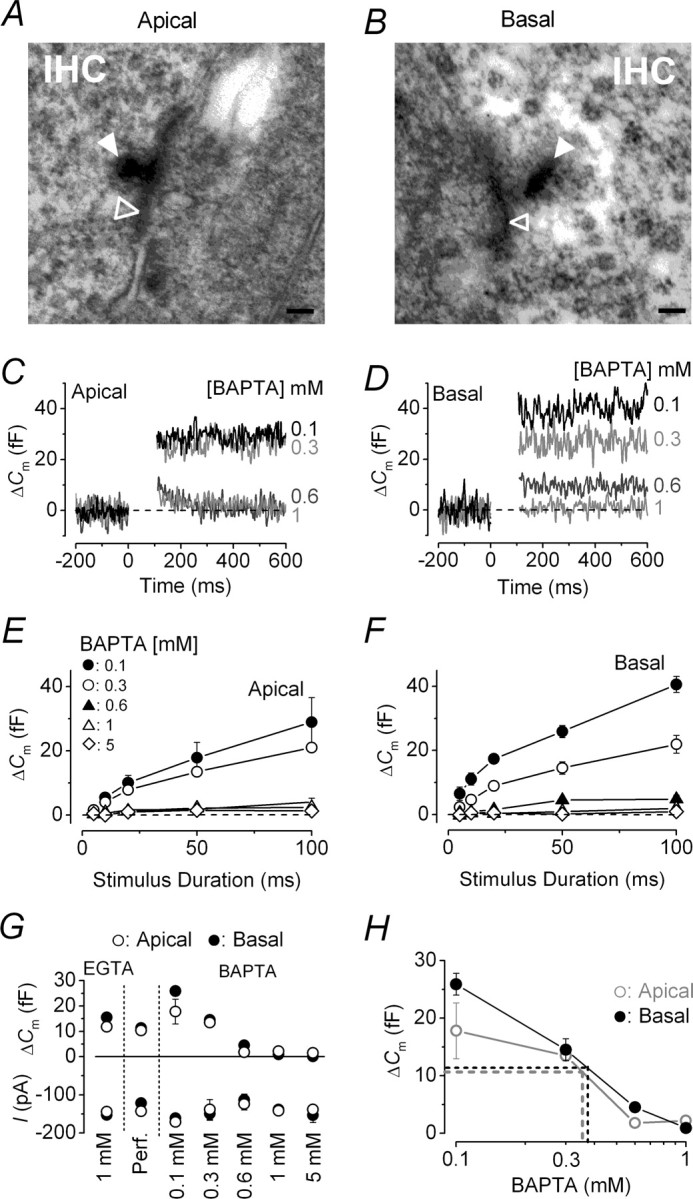
Figure 5.

Shape of ribbon synapses and their functional coupling with Ca2+ channels. A, B, Typical cross-sectional profiles of synaptic ribbons from an apical and a basal IHC, respectively. Note that the ribbon (filled arrowheads) in the apical IHC (A) had a round cross-sectional profile, whereas that in the basal cell (B) was elongated in shape. Open arrowheads indicate synaptic membrane thickenings. Scale bar, 100 nm. C, D, ΔCm from apical and basal IHCs, respectively, in response to a 100 ms voltage step (to approximately −11 mV) using different intracellular BAPTA concentrations (indicated next to the traces). E, F, Average ΔCm to voltage steps from 5 to 100 ms in apical and basal IHCs. G, Average ΔCm and peak ICa at 50 ms from data shown in E and F, including those in EGTA from Figure 4B. Number of cells in EGTA (1 mm), perforated-patch, and different concentrations of BAPTA (0.1, 0.3, 0.6, 1, 5 mm) are as follows: apical, 13, 5, 3, 5, 4, 5, 3; basal, 13, 7, 3, 4, 5, 4, 3. H, Estimation of the endogenous buffer concentration. The perforated-patch values of ΔCm were extrapolated (dotted lines) to those obtained using different BAPTA concentrations (data as in G). Error bars indicate SEM.
