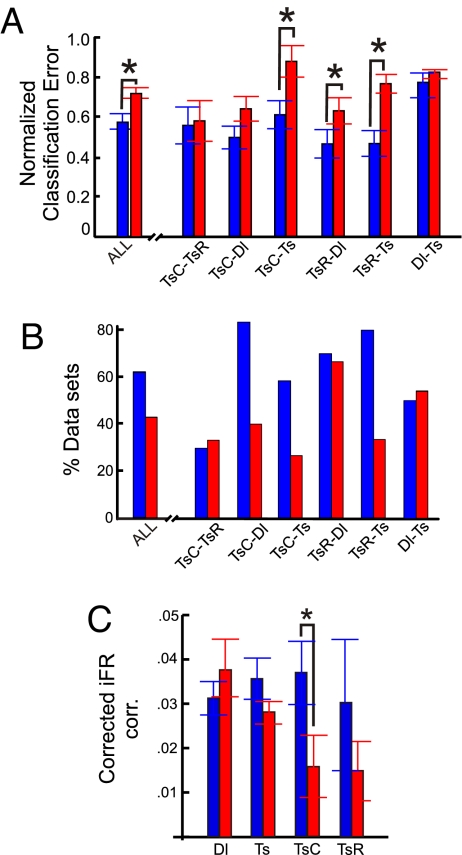
Fig. 3.
Breakdown of separability in MUA space and decrease of correlations are associated with a rise in behavioral errors. (A) Separability of task epochs in MUA space as given by the normalized (to the surrogates) classification errors for the low (0–1; blue bars) and high (≥2; red bars) behavioral error trials. The graph shows overall separability averaged across all pairs of delay and test phase comparisons and separately for all epoch-pair comparisons from the delay + test phases. Asterisks denote a significant (P < 0.05) difference in separability for high and low behavioral error trials. (B) Percentage of individual datasets for which a significant separation of task epochs was reached for the low (blue bars) and high (red bars) behavioral error groups, averaged across all delay + test phase comparisons, and separately for all delay + test phase comparisons. (C) Absolute iFR correlations averaged across all cell pairs in the low (blue bars) vs. high (red bars) behavioral error groups as a function of task epoch, corrected by subtracting the average iFR correlations obtained for the respective iFR-shuffled surrogates.

