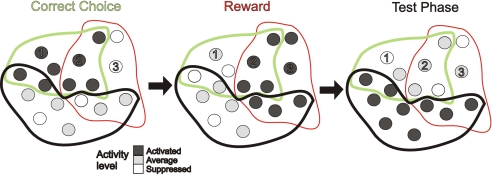
Fig. 4.
Schema of a functional architecture that could explain the present results. Shown are three cell assemblies corresponding to correct choices (green), reward epochs (red), and basic test epochs (black). Neurons enclosed by the same colored outline are embedded within the same assembly, with neurons shared among assemblies being located within the intersections of the colored outlines. The firing rate of a neuron is indicated by its gray level. As the task progresses, first choice assemblies are activated (Left), followed by reward assemblies (Center), followed by a general test phase assembly (Right). Neurons 1 and 2 give an example of a pair that would be correlated during activation of the choice-assembly, as they form part of the same activated assembly but may be uncorrelated during the reward and test epochs. Neuron 3 is an example for a cell that is suppressed during correct choices due to mutual inhibition among assemblies (not illustrated for clarity), activated during the reward epoch, and fires at its average baseline activity in the test epoch. Neuron 2, in contrast, would be activated in both the choice and reward epochs. Recording from such a neuron would therefore allow one to differentiate between choice or reward epochs and the test phase, but not between choice and reward epochs. Hence, depending on a neuron's participation in various assemblies, numerous patterns of differential activity may be observed for single units, whereas at the same time, the cell assembly gives rise to a unique pattern at the network level.

