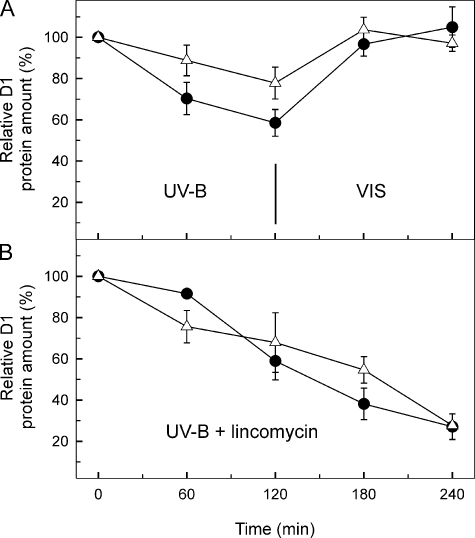
FIGURE 7.
Change in the total D1 protein content in heat preconditioned WT (circles) and Q16R (triangles) cells challenged by UV-B stress. D1 content in samples was followed during UV-B stress and subsequent recovery (A) or tested upon prolonged UV-B treatment in the presence of lincomycin (B). The data are obtained by densitometry of the Western blots and are the means of three parallel experiments. The results are expressed as percentages of the initial D1 protein level. VIS, visible light.

