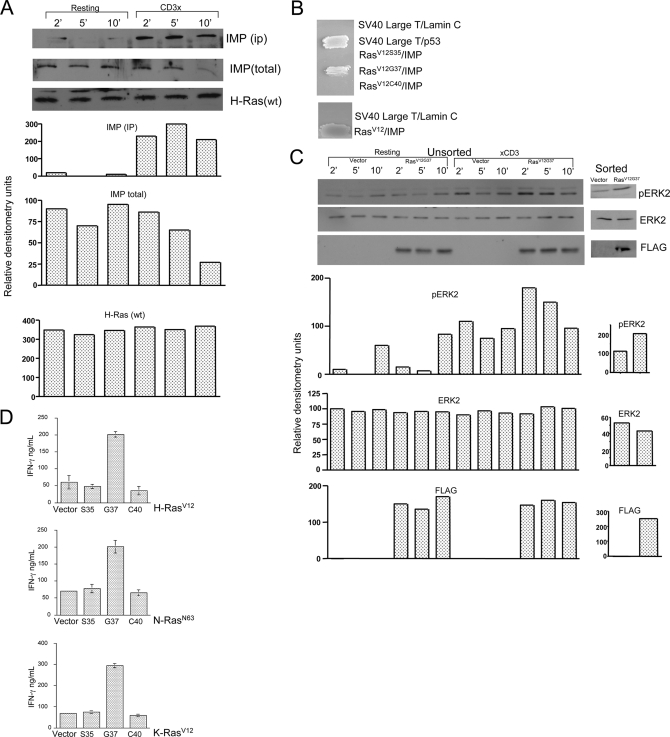
FIGURE 3.
Ras-mediated repression of Imp contributes to ERK activation and increased IFN-γ output in CD4 T cells. A, Imp Western blot analysis of anti-H-Ras immunoprecipitates. CD4 T cells isolated from AND TCR B10.BR mice and transduced with wild type FLAG-Ras in pMSCV were sorted for GFP expression. Following an 8-h resting period in 0.5% fetal calf serum, the cells were incubated on ice for 30 min with 1.0 μg/ml of anti-CD3 mAb (clone C363.29B) or left alone and then treated for 2, 5, and 10 min at 37 °C with 100 μg/ml of goat anti-rat secondary antibody. Next, the cells were lysed and Ras-associated Imp was isolated by incubation of the lysates with protein A-bound anti-FLAG antibody. The materials collected were run on the 9% acrylamide gel and analyzed by Western blotting for the levels of FLAG-Ras, associated Imp, and total Imp. B, yeast two-hybrid analysis of the association between H-RasV12 effector loop mutants and a region of Imp encompassing amino acid residues 273 to 377 (see “Experimental Procedures”). Cotransformants were patched onto plates lacking Trp, Leu, His, and Ade. Streaks of the colonies carrying SV40 large T and p53, or SV40 large T and laminin were included in the assay as positive and negative controls, respectively. C, Western blot analysis of activated ERK in CD4 T cells transduced with RasV12G37. Sorted (right) or unsorted (∼15% GFP-positive cells, left) AND TCR CD4 T cells that expressed either GFP alone or RasV12G37 were rested for 8 h in 0.5% fetal calf serum. The cells were then stimulated with anti-CD3 mAb, as described in A, and then analyzed by Western blotting for the presence of phosphorylated ERK, total ERK, and FLAG-RasV12G37. D, RasV12G37 selectively augments the production of IFN-γ in CD4 T cells. AND TCR-transgenic CD4 T cells were stimulated with pMCC (5μg/ml)-loaded APCs and then transduced with effector loop mutants (Ser35, Gly37, or Cys40) of H-(top), N-(middle), and K-Ras (low), as indicated. At 72 h posttransduction, the cells were sorted for GFP fluorescence, then restimulated with pMCC/APCs and finally analyzed for IFN-γ secretion by ELISA (plotted as mean ± S.D.).

