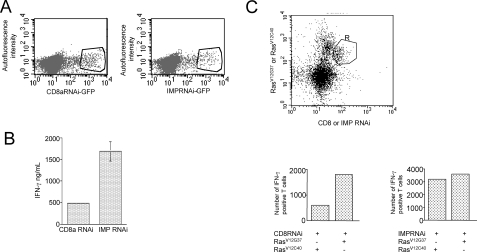
FIGURE 4.
Imp is positioned downstream of Ras in the regulation of IFN-γ response. A, FACS analysis of AND TCR CD4 T cells lentivirally transduced with CD8a-(left) or Imp-(right) specific RNAi. The cells were stimulated with APCs and pMCC (5 μg/ml) for 48 h and then spin-infected with lentiviral preps. After an additional incubation period (96 h), GFP-positive T cells were sorted and used for further analysis as depicted in B and C. B, analysis of IFN-γ secretion in CD4 T cells transduced with Imp RNAi. CD4 T cells expressing CD8- or Imp-specific RNAi were sorted for GFP expression and restimulated for 24 h with APCs plus pMCC (5 μg/ml). After restimulation, the culture supernatants were harvested from triplicate cultures and analyzed by ELISA. One representative of three experiments is shown. C, FACS analysis of intracellular IFN-γ in CD4 T cells transduced with RasV12G37 and Imp-specific RNAi. Top, AND TCR CD4 T cells lentivirally transduced with CD8 or Imp RNAi were restimulated with pMCC and APCs for 48 h and then transduced a second time with RasV12G37 or RasV12C40 (control) in a pMIGR2 retroviral plasmid in which human tailless CD2 has replaced GFP. After an additional 48-h rest, the cells were rested and briefly stimulated again as described under “Experimental Procedures.” Finally, the cells were stained for the extracellular portion of human CD2 and intracellular accumulation of IFN-γ. The cells that were positive for both GFP and Ras construct (e.g. CD8RNAi/RasV12G37, CD8RNAi/RasV12C40, ImpRNAi/RasV12G37 and ImpRNAi/RasV12C40) were gated (R) and analyzed for IFN-γ-production (bottom). The data are expressed as total number of cells that stained positive for intracellular expression of IFN-γ. One representative of three experiments is shown.

