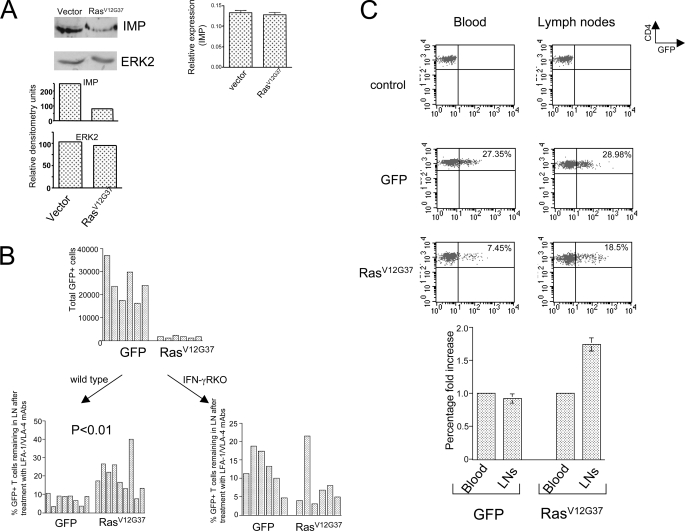
FIGURE 5.
Ras/Imp signaling pathway regulates in vivo traffic of CD4 T cells. A, Western blot analysis of Imp in T cells with RasV12G37. CD4 T cells isolated from the spleens of mice expressing either inducible RasV12G37-IRES-GFP or GFP (vector) were processed to obtain cell extracts and analyzed by RT-PCR (right panel) or staining Western blots with anti-Imp and anti-Erk (control) antibodies (left panel). One representative of three experiments is shown. B, top, analysis of the distribution of GFP-positive, RasV12G37-positive CD4 T cells, and GFP-positive CD4 T cells (controls) in recipient mice after adoptive transfer. B6 mice were injected with aliquots containing 5 × 10⁶ CD4 T cells of which ∼25% cells were transduced with either RasV12G37 or GFP alone. Then 48 h after adoptive transfer, the animals were sacrificed and their inguinal lymph nodes were analyzed for the total cell number and percentage of GFP-positive CD4 T cells. Bottom, analysis of egress of RasV12G37 + CD4 T cells from the lymph nodes. Wild-type (left) or IFN-γR knock-out (right) B6 recipient mice were treated as described in the top part, or in addition received an intraperitoneal injection of phosphate-buffered saline or 100 μg of LFA-1 and VLA-4 mAbs 48 h after the adoptive transfer, as described previously (35). After an additional 15 h, the mice were sacrificed and their inguinal lymph nodes were processed as described above. The data are expressed as percentages of an average GFP- or RasV12G37-IRES-GFP-positive CD4 T cell count in mice that received phosphate-buffered saline. Each bar represents a single animal. C, top, FACS analysis of CD4 T cells isolated from transgenic mice expressing inducible RasV12G37. Wild-type mice (upper) and transgenic mice expressing either GFP alone (middle) or RasV12G37 GFP (lower) were subjected to a doxocycline diet for 2 weeks and sacrificed for an analysis of GFP-positive CD4 T cells isolated from their inguinal lymph nodes (right) and peripheral blood (left). Bottom, the average fold change of the percentage of GFP-positive CD4 T cells in the lymph nodes (LNs) compared with the peripheral blood. The mean ± S.D. are shown (n = 3).

