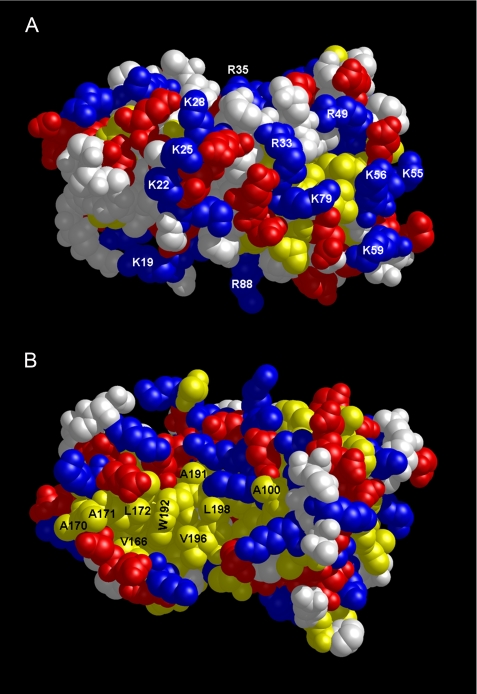
FIGURE 3.
Surface representation of FCaBP protein structure. Space-filling models of FCaBP depicting the positively charged, membrane-binding interface (A) and exposed hydrophobic surface (B). The orientations are similar to those in Fig. 2B. Exposed hydrophobic, basic, and acidic residues are highlighted in yellow, blue, and red, respectively.

