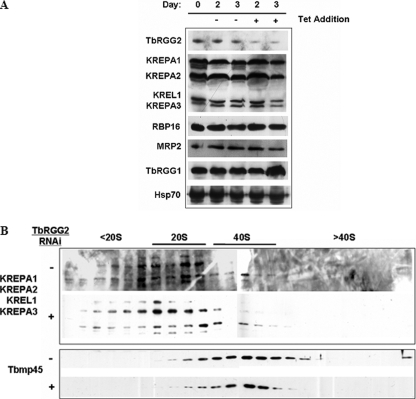
FIGURE 8.
Effect of TbRGG2 down-regulation on steady state levels of other editing related proteins. A, PF TbRGG2 RNAi cells were collected prior to induction and on days 2 and 3 following tetracycline induction and immunoblotted for the indicated proteins. Hsp70 was used as an indicator for equal protein loading. All lanes correspond to 1 × 10⁶ cells, except the editosome components (KREPA1, KREPA2, KREL1, and KREPA3), for which 1 × 10⁷ cells were analyzed. The apparent increase in TbRGG1 on day 6 was not reproducible. B, mitochondrial extracts from TbRGG2 RNAi cells, either uninduced (–) or induced for 3 days (+), were separated on 10–30% glycerol gradients as in Fig. 4. The sedimentation patterns of the 20 S editosome components KREPA1, KREPA2, KREPA3, and KREL1, as well as the 40 S marker, Tbmp45, were detected by Western blot.

