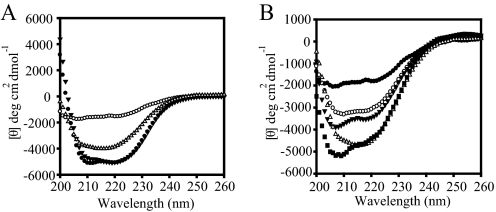
FIGURE 4.
Mutant forms of eEF1A show enhanced thermostability compared with the wild type protein. The wavelength spectrums of the 0.2–0.4 mg/ml purified proteins are carried out at the indicated temperatures. A, circular dichroism spectra of wild type eEF1A (• and ○) and A112T (▴ and ▵) forms of eEF1A. The closed symbols represent the wavelength spectrum at the native state (25 °C), whereas open symbols represent the spectrum at 70 °C. B, circular dichroism spectra of the mutant forms of eEF1A, R146K (○), T22S (▴), A112T (▵), and A117V (▪), in comparison with wild type (•) at 70°C.

