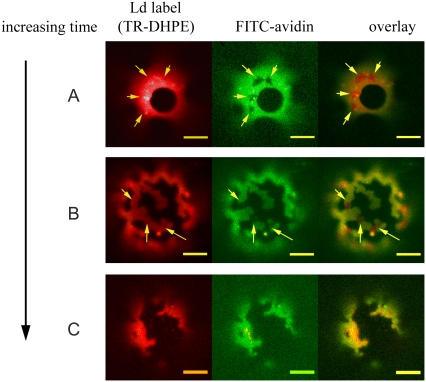
FIGURE 2.
Lipid partitioning as shown by a TR-DHPE probe (left) and protein organization as shown by FITC-avidin (middle) for different GUVs composed of DOPC/BSM/cholesterol in ratios of 50:30:20 and 5% biotinyl-DOPE (A) after ∼10 min, (B) after ∼60 min, and (C) after ∼90 min. Yellow arrows indicate protein crystals in the Ld phase. Scale bars are 10 μm.

