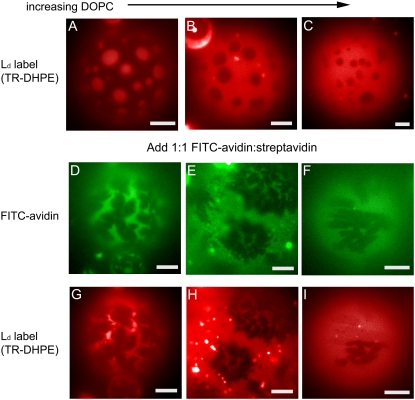
FIGURE 3.
Effect of protein crystals on morphology of lipid phases for different lipid compositions in the following ratios of DOPC/BSM/cholesterol: (A, D, and G) 30:42:28, (B, E, and H) 50:30:20, (C, F, and I) 70:18:12. The first row (A–C) shows bare vesicles under Texas Red lipid probe illumination with characteristically round lipid domains. The middle row (D–F) shows the excitation of FITC-avidin, highlighting the streptavidin domains (dark) on the same vesicles shown under Texas Red lipid probe illumination in the right column (G–I). Scale bars are 20 μm.

