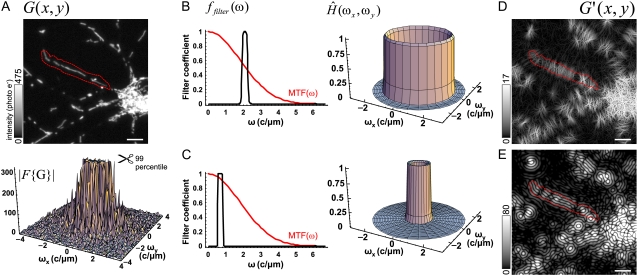
FIGURE 1.
Computation of the thinness ratio. (A) Confocal maximum intensity projection image of a mito-DsRed2-expressing cortical neuron; original image (G(x,y)) and the absolute value of its discrete Fourier transform  The maximal spatial frequency of the Fourier transform was 1/(2 × 0.075μm) = 6.67cycles/μm, where 0.075 μm is the pixel size in the space domain. For better visualization, ω is cropped at 4 c/μm. (B and C) HBP (B) and LBP (C) filter and transfer functions, ffilter(ω) and
  correspond to Eqs. 4 and 2, respectively. The theoretical MTF(ω) for confocal microscopy is shown by the red trace (NA = 1.3, λ = 590 nm, nmedium = 1.33, dpinhole = 1.2 Airy units or resels (1 resel = 0.61λ/NA); see Eqs. S1–S6 and Figs. S1 and S2 in Data S1). (D and E) Fluorescence images after filtering (
 ). Intensities can be directly measured by averaging pixel values in regions of interest, as indicated by the red dashed line. Scale bar, 5 μm. Fluorescence intensity is given in photoelectrons (the used gain settings resulted in 1.9 gray value units/photoelectron). Images are printed at γ = 1.6. See example for filtering in Data S2.

