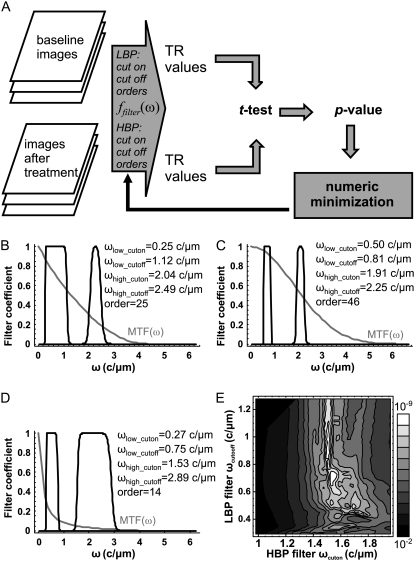
FIGURE 2.
Optimization of the filter functions. (A) Scheme of the optimization. Parameters of the two filter functions corresponding to the HBP and LBP filters were determined by numeric optimization using differential evolution to find the global minimum of the p-value. (B–D) Filter functions optimized for alamethicin-evoked mitochondrial swelling in different microscope configurations. Filters are shown without normalization (Eq. 5). Optimized filter functions for wide-field imaging on astrocytes (B) (recorded as single-image plane; λ ≈ 590 nm, 0.1 μm/pixel, NA = 1.3, corresponding to Fig. 5), confocal imaging of neurons (C) (recorded as mean-intensity projected z-stacks; λ ≈ 590 nm, 0.075 μm/pixel, NA = 1.3, corresponding to Fig. 8), and wide-field imaging of mixed cortical cultures (D) (recorded as mean-intensity projected z-stacks; λ ≈ 535 nm, 0.1 μm/pixel, NA = 1.3, corresponding to Fig. 10). (E) Contour plot showing p-values of the optimization in a logarithmic scale as a function of ωcutoff of the LBP filter and ωcuton of the HBP filter. The diagram was generated on the same image sequence that was used for the optimization in D. The other three parameters were taken from D. See example for NMinimize in Data S2.

