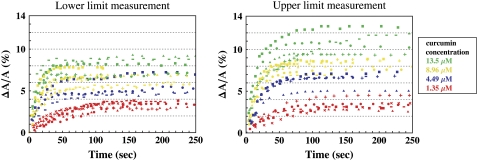
FIGURE 3.
Time sequence of fractional area changes of individual DOPC GUVs exposed to various concentrations of curcumin: 13.5 μM (green), 8.96 μM (yellow), 4.49 μM (blue), 1.35 μM (red). Different symbols represent different runs. (Left) For each run, the osmolality of the solution in the observation chamber, including curcumin/DMSO, was made the same as the 200 mM sucrose solution inside the GUV. (Right) For each run, the curcumin/DMSO solution was added to a sucrose/HEPES solution that had the same osmolality as the 200 mM sucrose solution inside the GUV.

