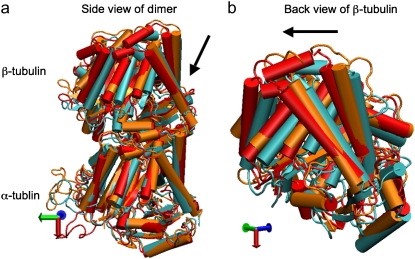
FIGURE 1.
Illustration of average coordinates of GTP-tubulin from MD simulations, superimposed with the average coordinates of curved GDP-tubulin from a simulation and straight GDP-tubulin from a zinc-induced tubulin sheet. The average curved tubulin dimers from the simulation are calculated by orienting each frame with respect to the straight tubulin dimer, based on the Cα atoms of α-tubulin. For better clarity, the superimposed dimer structures are shown in different views: (a) side view consisting of the whole dimer, and (b) back view consisting of only the β-tubulin monomer. Arrows indicate the directions of bend, as viewed from different angles. Red and orange represent the average GDP-tubulin and GTP-tubulin, respectively, from MD simulations; cyan represents the straight GDP-tubulin from the tubulin sheet.

