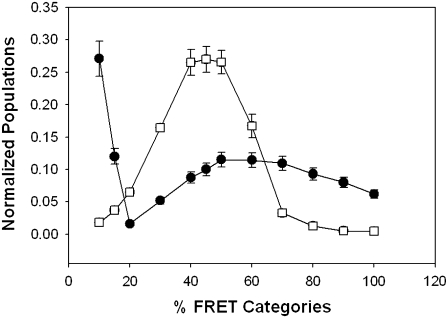
FIGURE 3.
Distributions of FRET values for Gαq and its effectors. Comparison of the distribution of the magnitude of the FRET values for eCFP-Gαq-eYFP-PLCβ (open squares) and eYFP-Gαq and p85α/eCFP-p110α (solid circles) in HEK293 cells. The FRET values for each complex were summed and normalized to 1.0. Standard deviation is shown.

