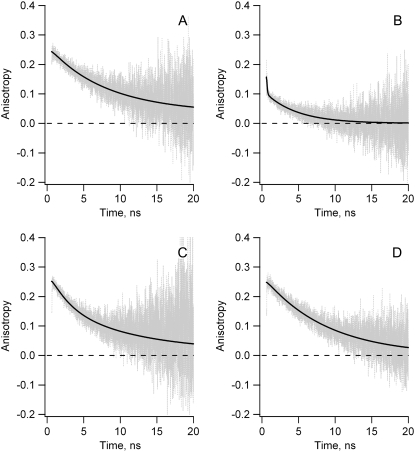
FIGURE 2.
Experimental fluorescence anisotropy decay curves r(t) (gray lines) and associated fits (black lines) obtained for fully folded native WT apoFD and tryptophan variants of apoFD. (A) W74-F128-F167: decay fitted to βrexp(−t/φr) with φr = 10.4 ns (βr = 0.24), χ2 = 1.04. (B) WT apoFD: decay fitted to βT1exp(−t/φT1) + βT2exp(−t/φT2) + βr}exp(−t/φr) with φT1 = 0.05 ns (βT1 = 0.05), φT2 = 6.9 ns (βT2 = 0.07), and φr = 10.4 ns (fixed, see text) (βr = 0.04), χ2 = 1.01. (C) W74-F128-W167: decay fitted to βT1exp(−t/φT1) + βr}exp(−t/φr) with φT1 = 3.3 ns (βT1 = 0.10), and φr = 10.4 ns (fixed, see text) (βr = 0.15), χ2 = 1.10. (D) W74-W128-F167: fitted to βrexp(−t/φr) with φr = 8.5 ns (βr = 0.25), χ2 = 1.05.

