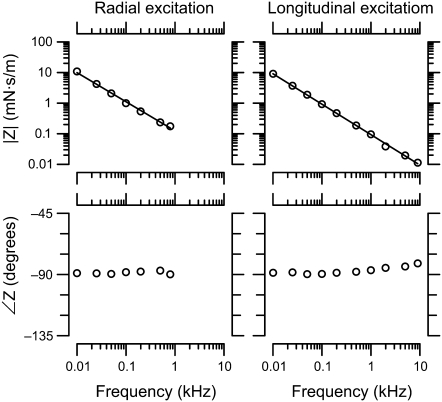
FIGURE 4.
Measured cantilever impedance versus frequency. The left plot shows the impedance of the atomic force cantilever as measured by the force probe for radial excitation, and the right is for longitudinal excitation. The least-squares power-law fit lines (solid lines) to the magnitudes had slopes of ∼−1, and the phase stayed near −90°.

