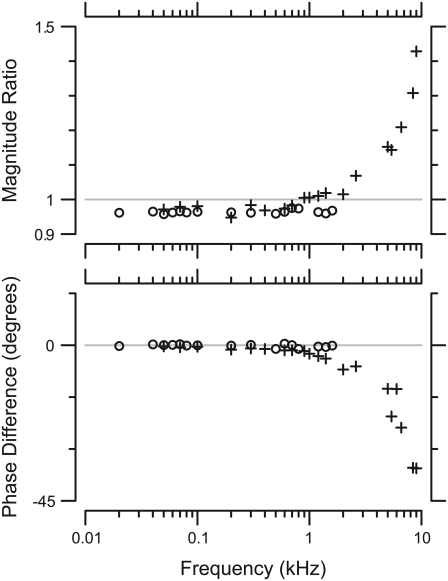
FIGURE 5.
Motion of probe in water. The graphs show the magnitude (top) and phase (bottom) of the ratio of plate displacement to base displacement for radial (○) and longitudinal (+) motions. The magnitude and phase of the ratio for radial motions remained relatively constant through the frequency range measured. For longitudinal motions, the magnitude and phase remained constant until ∼2 kHz. Above that frequency the magnitude increased and the phase decreased.

