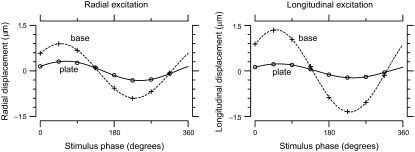
FIGURE 6.
Typical motions of probe on TM over one stimulus cycle. The left plot shows radial displacement over one stimulus cycle for radial excitation, and the right one shows longitudinal displacement for longitudinal excitation. The motions of the base (plusses) and plate (circles) were approximated by sinusoidal functions (dashed and solid curves). The amplitude of motion of the plate, which contacted the TM, was smaller than that of the base. These measurements were for TM preparation 3 at stimulus frequency 100 Hz.

