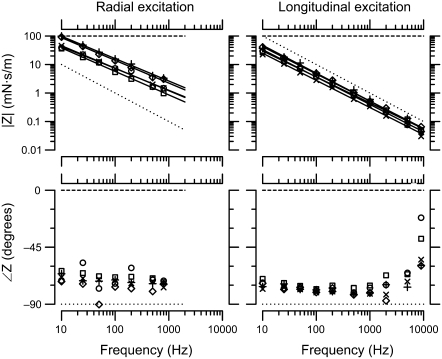
FIGURE 7.
TM impedance versus frequency. The magnitude (top) and phase (bottom) of TM shear impedance are plotted versus frequency for both radial (left) and longitudinal (right) forces. Different symbol types represent individual TMs. The lines represent least-squares power-law fits to measurements from individual TMs. The slopes of these power-law relations were −16 ± 0.4 dB/decade and −19 ± 0.4 dB/decade for radial and longitudinal forces, respectively. The dotted and dashed lines represent the frequency response of a pure elastic spring (slope −20 dB/decade and phase −90°) and a pure viscous damper (slope 0 and phase 0°), respectively.

