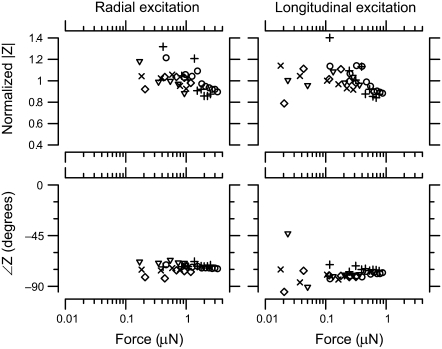
FIGURE 8.
TM impedance versus force. The left panel shows normalized magnitude and phase of TM impedance as a function of applied force in response to radial forces at 100 Hz, and the right panel shows the same measurement for longitudinal forces. The different symbol types represent different TMs. The magnitudes were normalized to their average value across forces for each TM.

