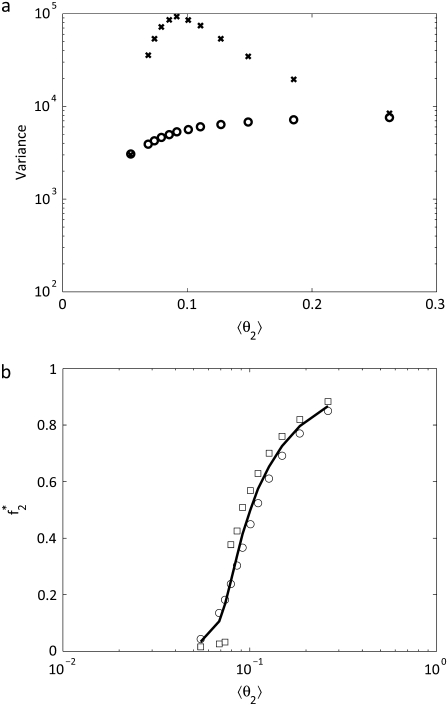
FIGURE 7.
(a) The variance of W* (circles) and X* (x-symbols) in a two-cycle cascade for different values of 〈θ2〉. The variance of W* is fairly constant while X* has a peak for intermediate values of 〈θ2〉. (b) The sensitivity of the second cycle in the cascade is shown by plotting f2* to different values of 〈θ2〉. The solid line is the solution to Eqs. 21 and 22, the circles are the average value, and the squares are the location of the maximum in the probability distribution.

