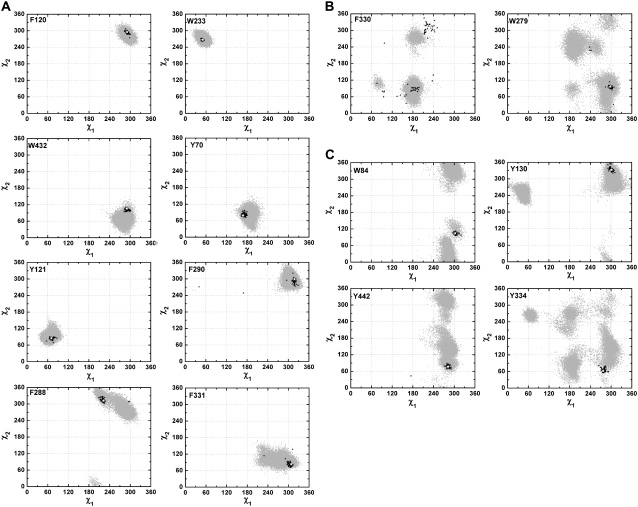
FIGURE 1.
χ1/χ2 plots for the 14 aromatic residues lining the active-site gorge of TcAChE. (A) Group I: F120, W233, W432, Y70, Y121, F290, F288, and F331; (B) Group II: F330 and W279; (C) Group III: W84, Y130, Y442, and Y334. The gray dots are derived from a 20-ns MD trajectory of native TcAChE. Each one represents a pair of χ1 and χ2 angles calculated based on snapshot structures of TcAChE extracted from the MD trajectory at 1-ps intervals. Thus, each plot contains 20,000 such dots. The white pentacle is the crystal structure (PDB code 1ea5) used for the MD simulation. The dark triangles present pairs of χ1 and χ2 angles calculated based on 47 crystal structures of TcAChE deposited in the PDB.

