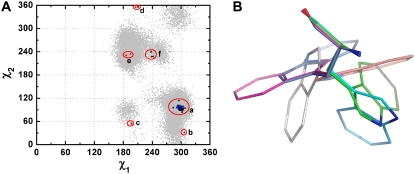
FIGURE 3.
(A) χ1/χ2 plot for TcAChE W279 and mAChE W286. The gray dots are derived from a 20-ns MD trajectory of native TcAChE as in Fig. 1. The blue pentacle corresponds to the conformation of W279 in the crystal structure (PDB code 1ea5) used as a starting model for the MD simulations. The dark triangles represent all the crystal structures of TcAChE; the red triangles represent those of mAChE (PDB codes 1q83, 2gyu, and 2gyv). (B) The snapshots of W279 (286) (fitted onto the backbone of the residue) corresponding to the six groups highlighted in A: (a) 1ea5 (green); (b) 1acj (cyan); (c) 1q83 (magenta); (d) 2gyu (gray); (e) 2gyv (blue); and (f) 2ckm (orange).

