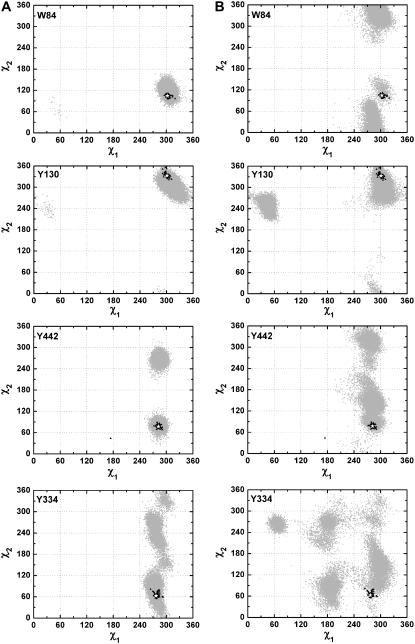
FIGURE 8.
(A) χ1/χ2 plots for W84, Y130, Y442, and Y334 generated from a 20-ns MD simulation of the native TcAChE monomer, applying force restraints to the main chain atoms. (B) χ1/χ2 plots for W84, Y130, Y442, and Y334, extracted from Fig. 1 C, generated from the 20-ns MD trajectory performed without any force restraints. In both cases, the native data set used was PDB code 1ea5.

