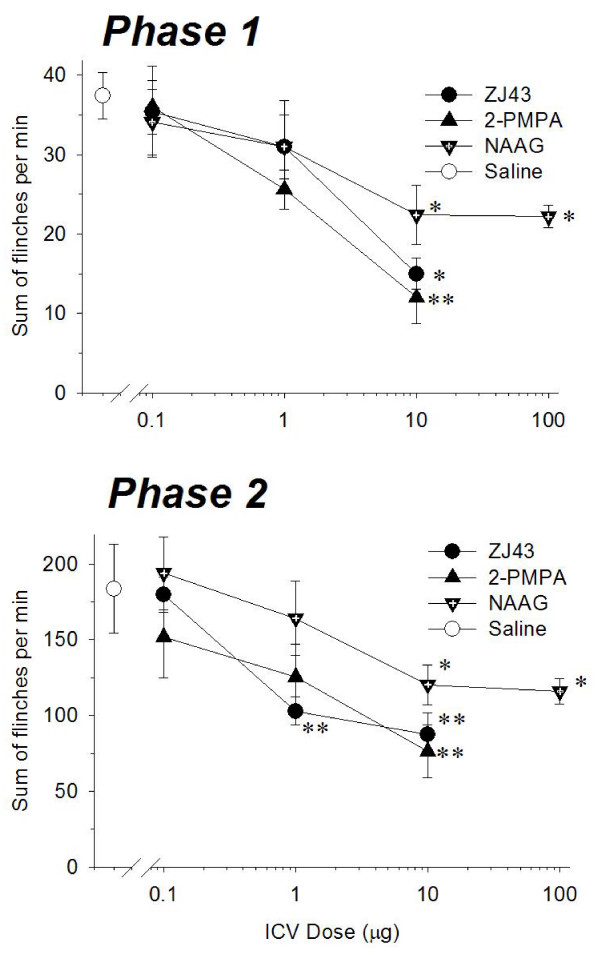
Figure 2.
Dose-response curves for ICV injection of ZJ43, 2-PMPA and NAAG representing the cumulative instances of formalin evoked flinches during the phase 1 (a) and the phase 2 (b). ZJ43, 2-PMPA and NAAG reduced the number of phase 1 and the phase 2 flinching behaviors in a dose dependent manner. Each point represents the group mean and S.E.M. of responses by groups of 5–6 rats. * <0.05 and ** <0.005 versus rats given saline ICV prior to formalin-induced inflammation.

