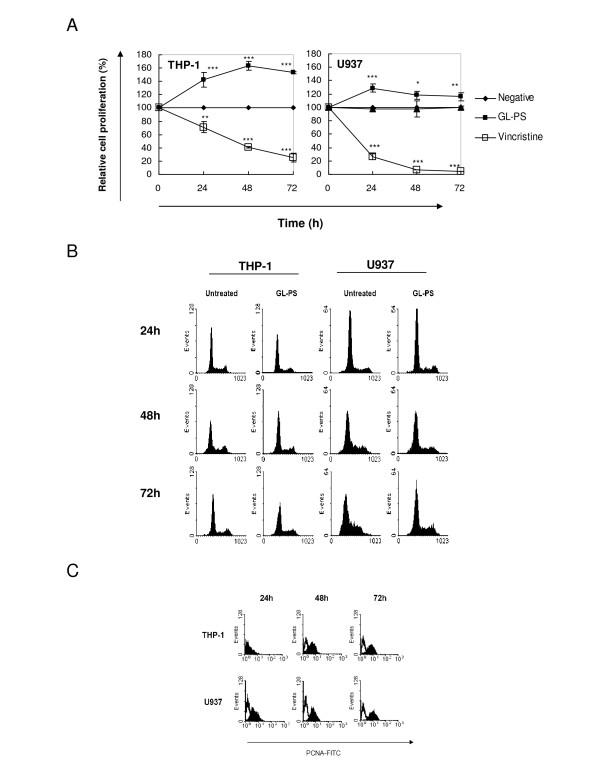
Figure 1.
(A) Leukemic cell proliferation induced by GL polysaccharides. The time-response curves for the effect of GL polysaccharides (GL-PS, -▪-) at 100 μg/mL and vincristine (-▫-) at 0.1 μM on THP-1 (Left panel) and U937 cells (right panel) determined by XTT cell proliferation assay. The results represent the mean ± SD of triplicate cultures of three representative experiments. *p < 0.05; ** p < 0.01; ***p < 0.001 versus negative control (-•-). (B) Cell cycle analysis with PI staining. The THP-1 (left panel) and U937 cells (right panel) were treated with or without 100 μg/mL GL-PS for three days. The cell cycle analysis was then analyzed with PI staining and Cylchred Version 1.0.2 (Cardiff University, Wales, UK). The results shown were from one representative experiment of three independent experiments performed. (C) PCNA expression of GL-PS treated THP-1 (upper panel) and U937 cells (lower panel) in three-day incubation. The results shown were from one representative experiment of three independent experiments performed.

