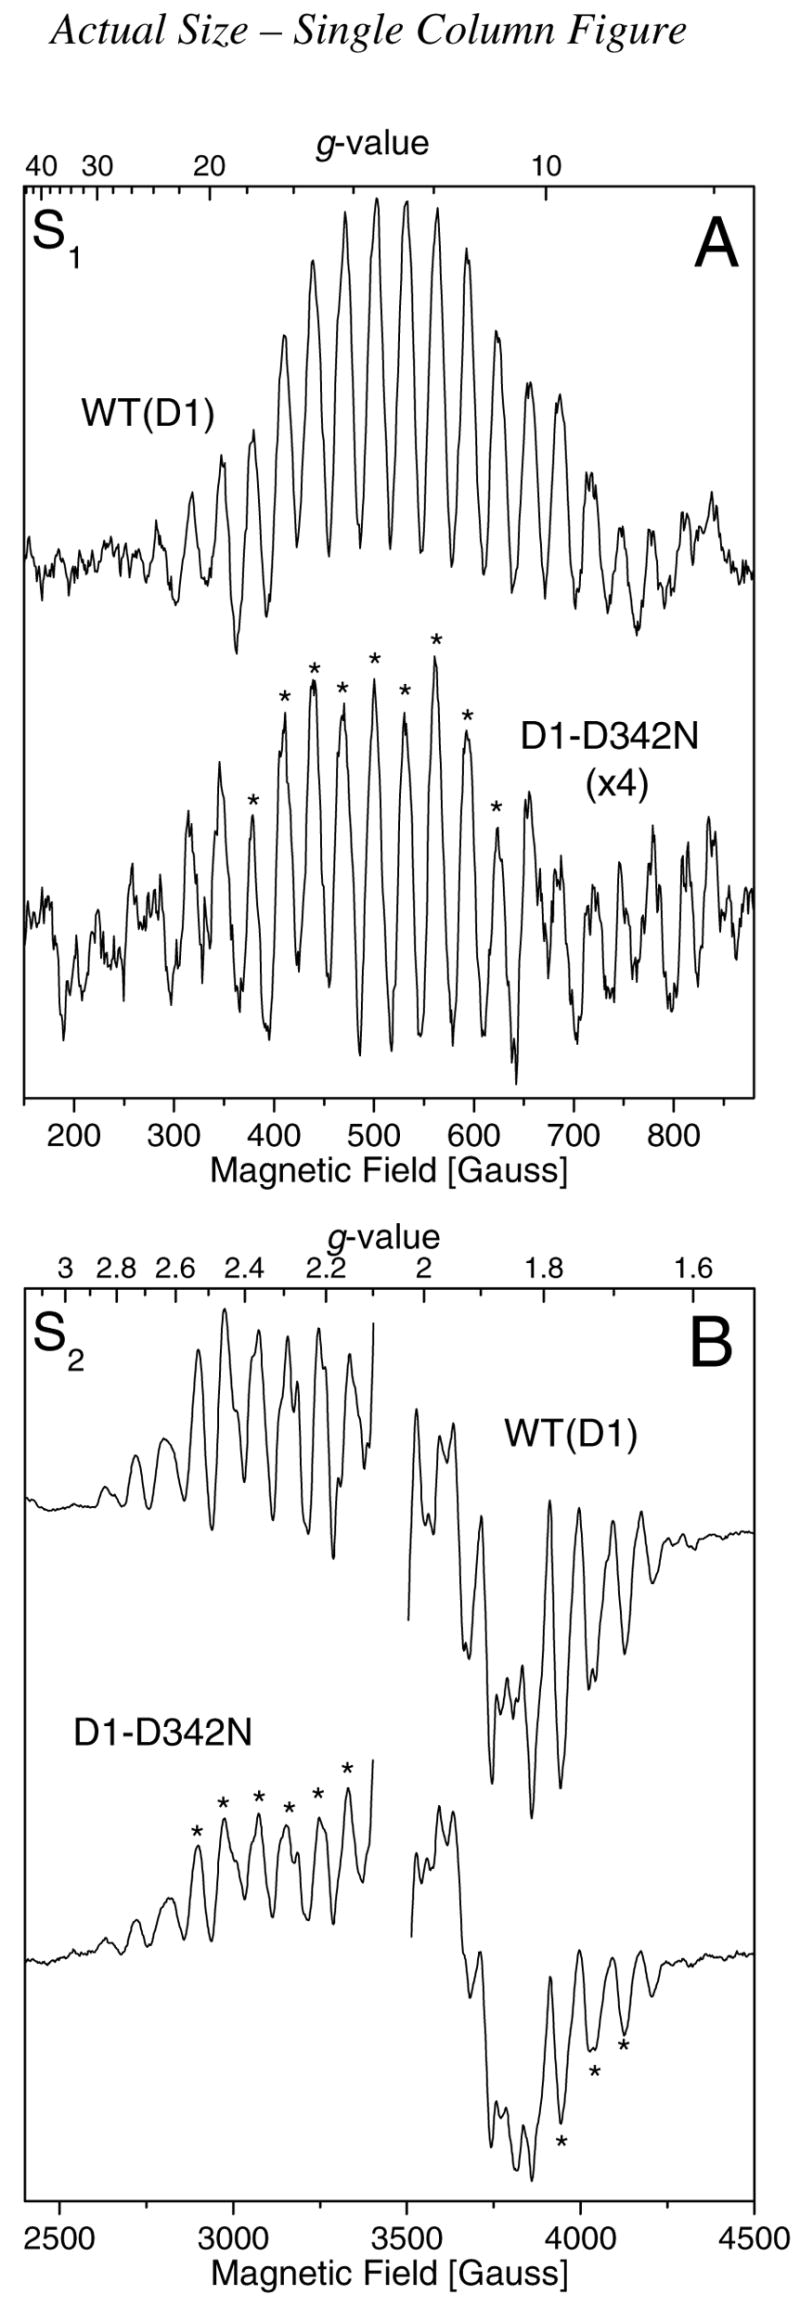
FIGURE 1.

Comparison of the parallel polarization S1 state multiline EPR signals (A) and light-minus-dark perpendicular polarization S2 state multiline EPR signals (B) of Synechocystis WT(D1) (upper traces) and D1-D342N PSII particles (lower traces). The same samples were examined in both (A) and (B), with the data in (A) being recorded before that in (B). The WT(D1) and mutant samples each contained approx. 7.5 mg of Chl/mL in 1.2 M betaine, 10% (v/v) glycerol, 10 mM MES-NaOH (pH 6.0), 10 mM CaCl2, 5 mM MgCl2, 50 mM histidine, 1 mM EDTA, and 0.03% (w/v) n-dodecyl β-D-maltoside. Samples were deaerated prior to measurement to remove dissolved O 2. For panel (A), the experimental conditions were as follows: microwave frequency of 9.42 GHz, microwave power of 50 mW, modulation amplitude of 9 G, modulation frequency of 100 kHz, time constant of 81 ms, conversion time of 162 ms, and temperature of 3.5 ± 0.5 K. For panel (B), the experimental conditions were as follows: microwave frequency of 9.68 GHz, microwave power of 10 mW, modulation amplitude of 9 G, modulation frequency of 100 kHz, time constant of 40 ms, conversion time of 81 ms, and temperature of 7.0 ± 0.5 K. To generate the S2 state, the samples in (B) were illuminated for 5 min at 195 K before being flash-frozen in liquid nitrogen. Both spectra in (B) have had the large signal of YD• at g = 2 excised for clarity. Each spectrum in (A) and (B) represents the accumulation of 60 scans. To facilitate comparison, the S1 state multiline EPR signal of the D1-D342N PSII particles in (A) has been multiplied vertically by a factor of 4.
