
Figure 3. Steric interference at M13 site 4.
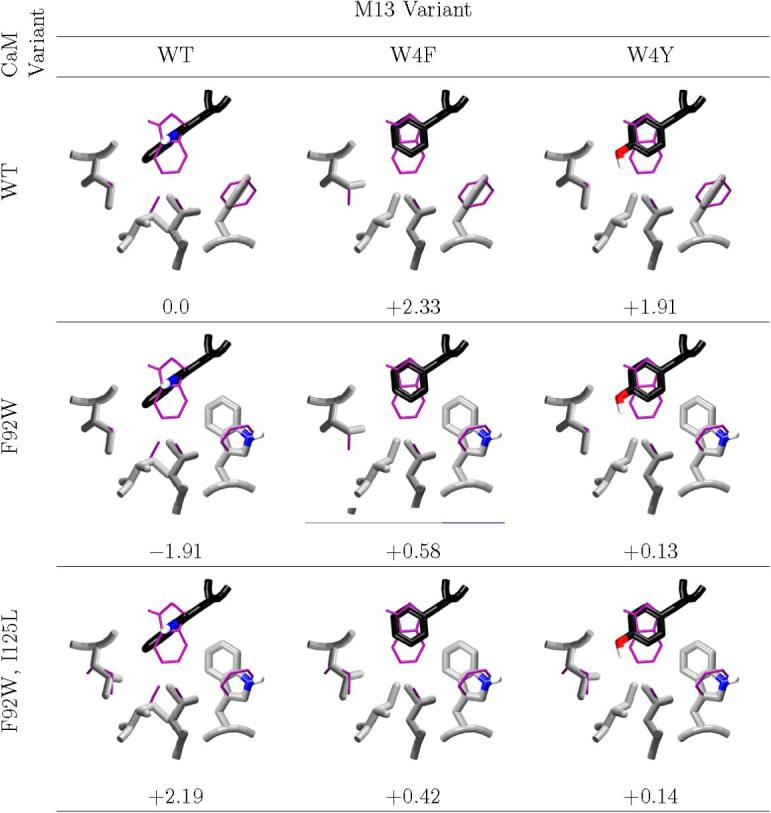
The computed minimum energy complex structures of design candidates and decoys at M13 position 4 are shown, along with the computed binding affinity, relative to wild-type. The desired complexes all have computed affinities within roughly 0.5 kcal/mol of wild-type; all but one decoy are computed to be destabilized by about 2.0 kcal/mol. In all cases, the wild-type NMR average structure is shown in thin purple. Carbons of M13 are colored black, and carbons of CaM are colored light grey. Structural figure generated with vmd (62) and raster3d. (61)