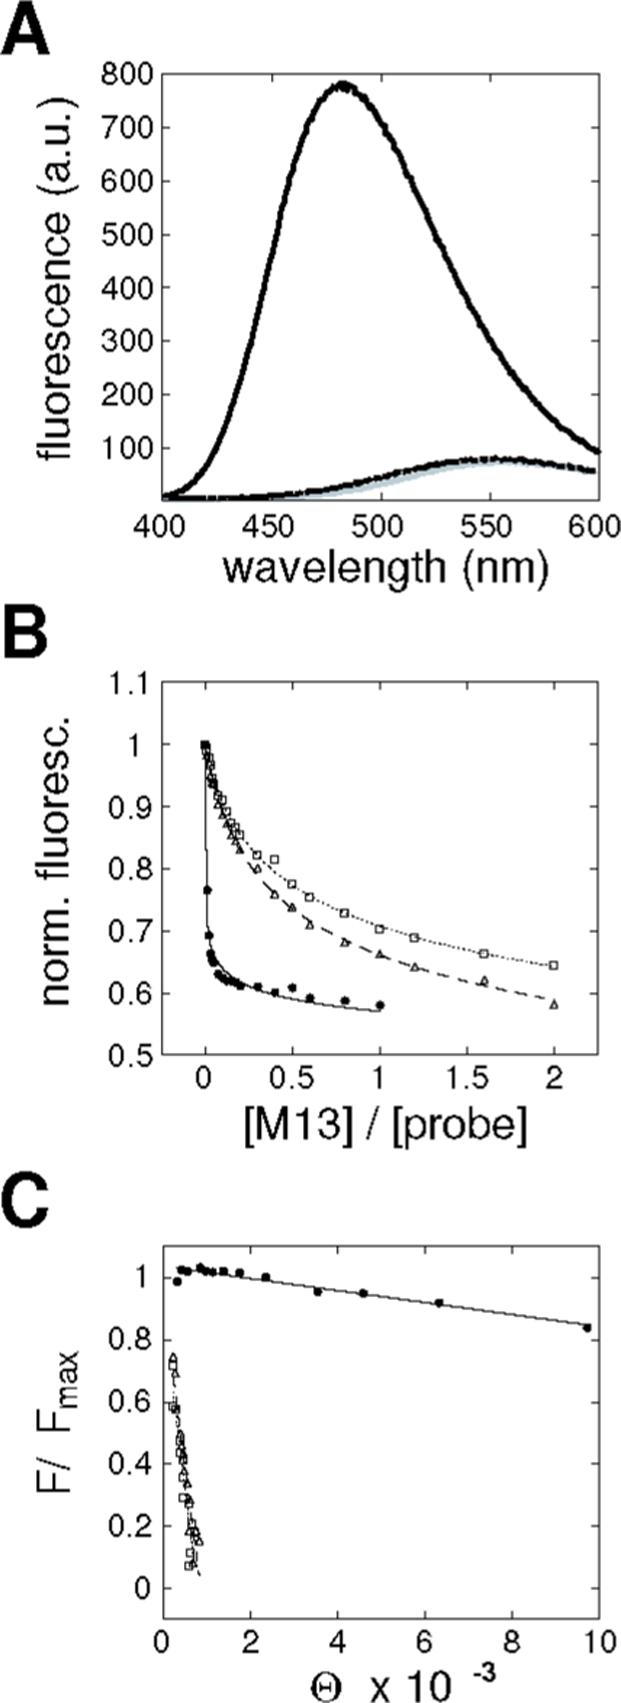
Figure 5. Determination of CaM/M13 binding constants.

(A) CaM/M13 binding constants were determined by titration in the presence of competing excess of a dansylated CaM-binding probe peptide. The probe exhibits low fluorescence in the absence of CaM (gray curve) or in the presence of wild-type CaM and 1 mM EDTA (dotted curve). In the presence of CaM and 100 μM CaCl2, however, the total probe fluorescence rises dramatically (solid curve) and shifts slightly toward lower wavelengths. (B) Fluorescence decreases progressively as competing M13 peptide is added to a solution of 10 μM probe peptide, 0.1 μM CaM, and 400 μM CaCl2. Normalized fluorescence is shown as a function of the ratio of M13 to probe concentrations, for titrations involving the CaM mutant F92W. Data are shown for addition of wild-type M13 (filled circles), M13 W4F (open triangles), and M13 W4Y (open squares). Curves are plotted as visual aids only. (C) Data from competition experiments as in (B) were transformed into plots of ΔF/ΔFmax vs. Θ, where ΔFmax and ΔF are the maximum fluorescence change, and the observed fluorescence change for each data point, respectively. Θ is a function of free M13 and probe concentrations, and is defined as (ΔF ΔFmax )([P] KP −1) [M13], with the probe concentration given by [P], and the dissociation constant for probe binding to CaM given by KP. Plots here were converted from data shown in panel B, and use the same symbols to refer to three M13 variants; slopes of the linear fits shown are equal to the dissociation constants for complexes of CaM with M13.
