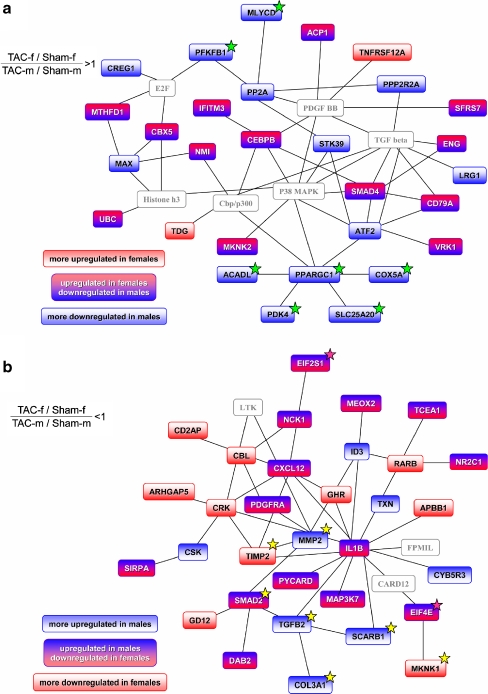
Fig. 6.
Networks of functionally related genes with a sex-specific regulation. Ingenuity Pathways Analysis was used to create networks derived from the two sets of genes with a relative upregulation in females (a) or in males (b; p < 0.05, ANOVA statistics). For each set, the network with the highest score is shown. Different combinations of the directions of deregulation in the comparison of TAC and sham for males and females could lead to a sex-specific expression pattern as indicated by the color code. Linking nodes not contained in the two sets of genes are colored gray. A number of genes in the female network (a) are related to energy metabolism (marked with green stars). They are grouped around PGC-1 (PPARGC1A, peroxisome proliferative activated receptor, gamma, coactivator 1, alpha). In contrasting, many of the genes in the male network are related to changes of extracellular matrix (highlighted with yellow stars) or biosynthesis (pink stars). The complete list of genes of the networks can be seen in Table e7 (Electronic supplementary material)

